Survey Study
Process description
Identify and Describe Research Problem
Description
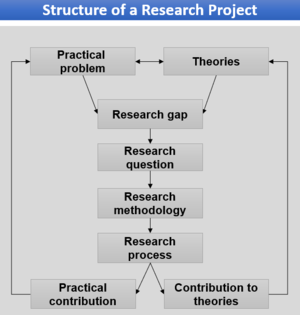
State why the problem you address is important. Result: What did you observe and what is the data basis for the findings? Discussion: What are the findings, what is the basis for the findings, could I come to the same findings and how do the results contribute to the theory? Conclusions: What did you learn and what does your work contribute to the field? [1]
Examples
Provide some examples of the activity 'Identify and Describe Research Problem'.
Further Readings
[1] Myers, M. D. (2009). “Qualitative Research in Business and Management”, SAGE Publications: Auckland, New Zealand.
[2] Bhattacherjee, A. (2012). "Social Science Research: Principles, Methods, and Practices", Textbooks Collection. 3. Available at: https://scholarcommons.usf.edu/oa_textbooks/3
[3] Perneger, T. V. & Hudelson, P. M. (2004). “Writing a research article: advice to beginners”, International Journal for Quality in Health Care: Vol. 16, no. 3, pp. 191-192.
Describe Research Gap
Description
Identifying a research gap through
Gap-spotting
go through existing literature on your phenomenon What are we missing? Problematization: dialectical interrogation familiar position, other stances, and the specific domain
Types of research gaps
Methodological conflict: Questioning if findings on a certain topic are inconclusive with regard to applied research methods. Contradictory evidence: Synthesize key findings and determine contradictions. Knowledge void: Analyze literature with regard to theoretical concepts (e.g., using the chart method) and look for specific gaps or under-researched areas of research. Action-knowledge conflict: Collect information about the action and relate this information to the knowledge base. Evaluation void: Analyze if research findings have been evaluated and empirically verified. Theory application void: Analyze the theories that have been employed to explain certain phenomena and identify further theories that might contribute to the knowledge base as well.
Examples
Further Readings
[1] Sandberg, J. & Alvesson, M. (2011). “Ways of constructing research questions: gap-spotting or problematization?”, Organization: Vol. 18, no. 1, pp. 23-44.
[2] Müller-Bloch, C. & Kranz, J. (2015). “A Framework for Rigorously Identifying Research Gaps in Qualitative Literature Reviews”, International Conference on Information Systems (ICIS): Forth Worth, Texas, USA.
Define Key Constructs
Description
General:
A construct …
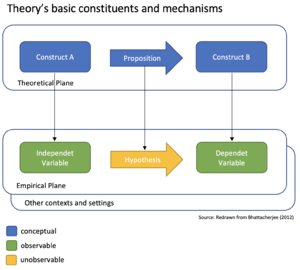
… is an abstract conceptual entity. … is inferred from observable actions or states of phenomena. … needs an operational definition to become measurable.
Construct clarity:
Captures essential properties and characteristics. Avoids tautology or circularity. As narrowly as possible, but still relevant and generalizable and its context. [2]
Examples
Further Readings
[1] Bhattacherjee, A. (2012). "Social Science Research: Principles, Methods, and Practices", Textbooks Collection. 3. Available at: https://scholarcommons.usf.edu/oa_textbooks/3
[2] Suddaby, R. (2010). "Editor's Comments: Construct Clarity in Theories of Management and Organization", Academy of Management Review, Vol. 35, no. 3, pp. 346-357.
[3] Bacharach, S. B. (1989). “Organizational Theories: Some Criteria for Evaluation”, The Academy of Management Review, Vol. 14, no. 4, pp. 496-515.
Articulate Research Question(s)
Description
What is determined by research questions?
Defines how to shape components of your research design. Points towards data collection and analysis techniques. Research designs vary for different kinds of research questions. Research questions can tend towards a qualitative or quantitative research. [1,3]
Examples
Types of research questions:
- Artifact only: How to design ______ in order to achieve ______ (dependent variable(s))?
- Prescriptive: What design principles/theory should guide the development of ______ in order to achieve ______ (dependent variable(s))?
- Descriptive: How do ______ (independent variable(s) influence ______ (dependent variable(s))?
Further Readings
[1] Creswell, J. W. (2009). “Research Design – Qualitative, Quantitative, and Mixed Methods Approaches”, SAGE Publications: Auckland, New Zealand.
[2] Meth, H., Brhel, M. & Maedche, A. (2013). “The state of the art in automated requirements elicitation”, Information and Software Technology: Vol. 55, no. 10, pp. 1695-1709.
[3] Bhattacherjee, A. (2012). "Social Science Research: Principles, Methods, and Practices", Textbooks Collection. 3. Available at: https://scholarcommons.usf.edu/oa_textbooks/3
Collect Justificatory Knowledge
Description
Covariance:
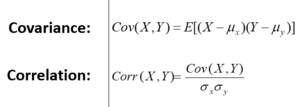
describes relationship between two or more variables presents how they vary together (positively or negatively) no information about strength of relationship (not normalized)
Correlation:
statements on strength possible (normalized covariance) always between -1 and +1 no information about direction of causality
Causality:
defines the direction of the relationship between two variables relationships are described based on logical reasoning Example: “If it had not rained yesterday (cause), I would have gone for a walk (effect).” [1]
Examples
Accumulation and evolution of design knowledge [2]
Further Readings
- Internal validity and external validity [3]
- Analysis of expriments [4]
[1] Sarstedt, M. & Mooi, E. (2011). “A Concise Guide to Market Research – The Process, Data, and Methods using IBM SPSS Statistics”, Springer Publishers: Heidelberg
[2] Hevner, A., vom Brocke, J. & Maedche, A. (2019). “Roles of Digital Innovation in Design Science Research”, Business & Information Systems Engineering: Vol. 61, no. 1, pp. 3-8.
[3] Bhattacherjee, A. (2012). "Social Science Research: Principles, Methods, and Practices", Textbooks Collection. 3. Available at: https://scholarcommons.usf.edu/oa_textbooks/3
Define Dependent Variables
Description
General:
A variable...
... is observable directly (manifest).
... is empirically measurable.
... is a representation of an abstract construct (latent).
Dependent variables are explained by other variables.
Examples
Further Readings
[1] Bhattacherjee, A. (2012). "Social Science Research: Principles, Methods, and Practices", Textbooks Collection. 3. Available at: https://scholarcommons.usf.edu/oa_textbooks/3
[2] Burton-Jones, A. & Straub, D. W. (2006). “Reconceptualizing System Usage: An Approach and Empirical Test”, Information Systems Research: Vol. 17, no. 3, 228-246.
Derive Hypotheses
Description
General:
A hypothesis...
... states (expected) relationships between variables.
... is empirically testable.
... is stated in a falsifiable form.
… can be strong or weak.
… should clearly specify independent and dependent variables.
Examples
Further Readings
[1] Bhattacherjee, A. (2012). "Social Science Research: Principles, Methods, and Practices", Textbooks Collection. 3. Available at: https://scholarcommons.usf.edu/oa_textbooks/3
Operationalize Dependent Variable(s)
Description
- Operationalization refers to the process of developing indicators or items for measuring these (abstract) constructs.
- Operationalize through levels of measurement (= rating scales: refer to the values that an indicator can take).
Levels of measurement:
- statistical properties of rating scales
- nominal scale
- ordinal scale
- interval scale
- ratio scale
- binary scale
- Likert scale
- semantic differential scale
- Guttman scale
Examples
Further Readings
[1] Bhattacherjee, A. (2012). "Social Science Research: Principles, Methods, and Practices", Textbooks Collection. 3. Available at: https://scholarcommons.usf.edu/oa_textbooks/3
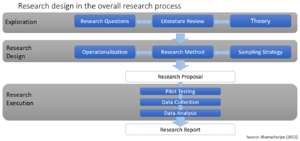
Create Research Design
Description
Survey:
collect self-reported data of people standardized questionnaire or interview
Simulation:
state a hypothesis imitate some real process or action to prove your hypothesis suitable for observing correlation between variables
Laboratory Experiment:
independent variables are manipulated by the researcher (as treatments) subjects are randomly assigned to treatment results of the treatments are observed
Field Experiment:
conducted in field settings, e.g. real organization rare, because of the difficulties associated with manipulating treatments and controlling for extraneous effects in a field setting
Examples
Further Readings
[1] Myers, M. D. (2009). “Qualitative Research in Business and Management”, SAGE Publications: Auckland, New Zealand.
[2] Bhattacherjee, A. (2012). "Social Science Research: Principles, Methods, and Practices", Textbooks Collection. 3.Available at: https://scholarcommons.usf.edu/oa_textbooks/3
Create Survey
Description
Operationalize all constructs: process of developing items (indicators) to measure constructs an item is, for example, a question in a questionnaire
Process:
Conceptualize: Define the domain and specify the meaning of the constructs.
Reuse: Search for existing pre-validated measures of similar constructs that my fit the current context.
Develop and test: New items may have to be designed for those constructs (long process to validate).
Examples
Further Readings
[1] Furneaux, B. & Wade M. (2011). “An Exploration of Organizational Level Information Systems Discontinuance Intentions”, MIS Quarterly: Vol. 35, no. 3, pp. 573-598.
[2] Venkatesh, V. et al. (2012). “Consumer Acceptance and Use of Information Technology: Extending the Unified Theory of Acceptance and Use of Technology”, MIS Quarterly: Vol. 36, no. 1, pp. 157-178.
[3] Bhattacherjee, A. (2012). "Social Science Research: Principles, Methods, and Practices", Textbooks Collection. 3.
Available at: https://scholarcommons.usf.edu/oa_textbooks/3
[4] Myers, M. D. (2009). “Qualitative Research in Business and Management”, SAGE Publications: Auckland, New Zealand.
Pilot Testing
Description
- Pilot testing is an often overlooked but extremely important part of the research process!
- helps detect potential problems in research design and/or instrumentation (e.g., whether the questions asked is intelligible to the targeted sample)
- ensures that the measurement instruments used in the study are reliable and valid measures of the constructs of interest
- pilot sample = small subset of the target population
Examples
Further Readings
[1] Bhattacherjee, A. (2012). "Social Science Research: Principles, Methods, and Practices", Textbooks Collection. 3. Available at: https://scholarcommons.usf.edu/oa_textbooks/3
Sampling Strategy
Description
choose target population and a strategy of how to choose samples related to the unit of analysis in a research problem avoid a biased sample
Sampling approaches:
Probability sampling:
- technique in which every unit in the population has a chance (non-zero probability) of being selected
- chance to be selected can be accurately determined
- sampling procedure involves random selection at some point
methods: random sampling, systematic sampling, stratified sampling, cluster sampling, matched pairs sampling, multi-stage sampling
Non-probability sampling:
- some units of the population have either zero chance of selection or the probability of selection cannot be determined accurately
- selection criteria are non-random (e.g. quota, convenience)
- estimation of sampling errors is not allowed
- information from a sample cannot be generalized back to the population
methods: convenience sampling, snowball sampling, quota sampling, expert sampling
Examples
Probability sampling:
Cluster sampling:
- divide population into clusters
- randomly sample a few clusters and measure all units within that cluster
Matched pairs sampling:
- two subgroups of population
- compare two individual units from subgroups with other
- ideal way to understand bipolar differences
Multi-stage sampling:
- combine the previously described sampling technique
- e.g. combine cluster and random sample
Random sampling:
- all subsets are given equal probability of being selected
- unbiased estimates of population parameters
Stratified sampling:
- divided into homogeneous and non-overlapping subgroups
- simple random sample within each subgroup
Systematic sampling:
- sampling frame is ordered according to some criteria
- elements are selected at regular intervals
Non-probability sampling:
Convenience sampling:
- take a sample from a population that is close to hand
- e.g. outside of shopping mall
- may not be representative, therefore limited generalization
Expert sampling:
- choose respondents in a non-random manner based on their expertise on the phenomenon
- findings are still not generalizable to a population
- e.g. in-depth study on an institutional factor such as Sarbanes-Oxley Act
Quota sampling:
- segment population into mutually exclusive subgroups
- take a non-random set of observations to meet pre-defined quota
- pre-defined quota can either proportional (as the overall population) or non-proportional (less restrictive)
- both are not representative of the population
Snowball sampling:
- start criteria-based
- ask respondents for further potential participants
Further Readings
[1] Bhattacherjee, A. (2012). "Social Science Research: Principles, Methods, and Practices", Textbooks Collection. 3. Available at: https://scholarcommons.usf.edu/oa_textbooks/3
Execute Survey
Description
General survey implementation:
- collect self reported data of people
- standardized questionnaire or interview
- suited to study preferences, thoughts, and behavior of people
- suited for descriptive, exploratory or explanatory research
- Example: Identify drivers for user satisfaction
Strengths:
- collect unobservable data (thoughts)
- remote collection
- convenient for respondents
- can detect small effects
Examples
Further Readings
[1] Bhattacherjee, A. (2012). "Social Science Research: Principles, Methods, and Practices", Textbooks Collection. 3. Available at: https://scholarcommons.usf.edu/oa_textbooks/3
Perform Survey Data Analysis
Description
General: construction of meaning through either convergence or extension of theoretical aggregation (replication is key) process of qualitative data analysis (GT example)
Examples
Provide some examples for the activity X.
Further Readings
[1] Miles, M. B. et al. (1994). “Qualitative Data Analysis – A Methods Sourcebook”, SAGE Publications: Auckland, New Zealand.
[2] Patton, M. Q. (2002). “Qualitative Research & Evaluation Methods”, SAGE Publications: Auckland, New Zealand.
Write up Results
Description
Results:
General:
- Report on collected data (response rates, etc.).
- Describe participants (demographic, clinical condition, etc.).
- Present key findings with respect to the central research question.
- Present secondary findings (secondary outcomes, subgroup analyses, etc.).
Briefly:
- What did you observe and what is the data basis for the findings?
- However, do not interpret or theoretically integrate findings yet!
Discussion:
General:
- Refer to the main findings of your study.
- Discuss how findings address your research question.
- Discuss main findings with reference to previous research.
- Discuss why results are new and how the findings contribute to the body of knowledge.
Briefly:
- What are the findings, what is the basis for the findings, could I come to the same findings and how do the results contribute to theory?
- However, do not judge or explain implications yet!
Conclusions:
General:
- Present scientific and practical implications of results.
- Outline the limitations of the study.
- Offer perspectives for future work.
Briefly: What did you learn and what does your work contribute to the field?
Examples
Further Readings
[1] Perneger, T. V. & Hudelson, P. M. (2004). “Writing a research article: advice to beginners”, International Journal for Quality in Health Care: Vol. 16, no. 3, pp. 191-192.


